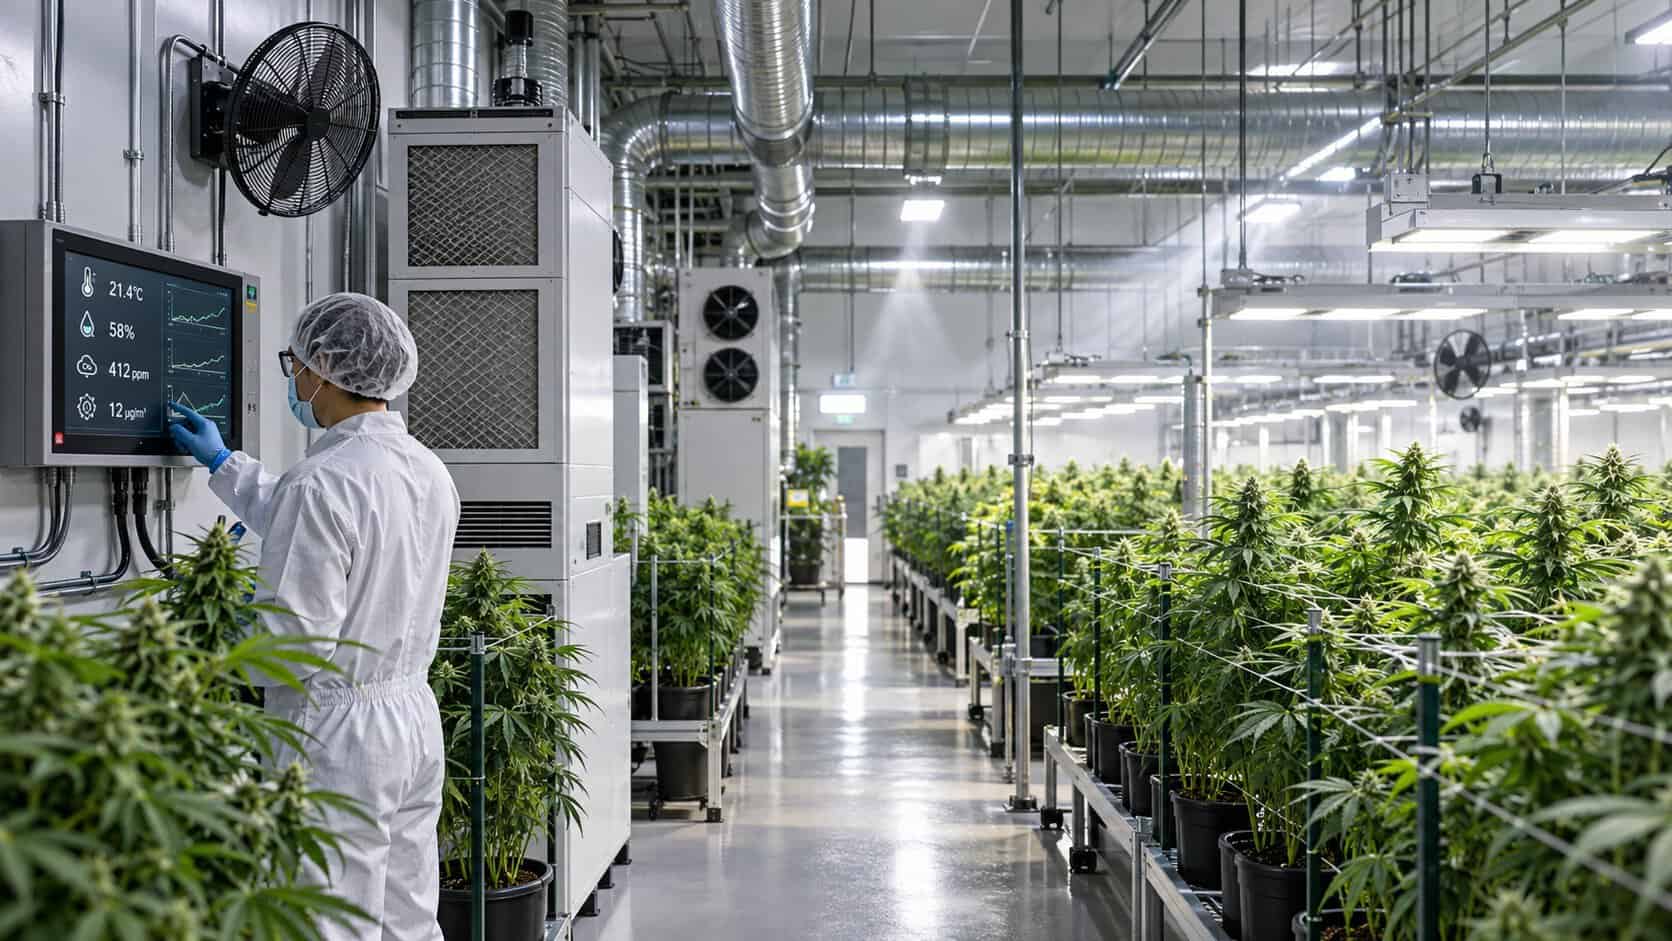
For three weeks in the summer of 2023, seven air quality monitors sat quietly among roughly 900 flowering cannabis plants in a converted commercial space in Central Oklahoma. They recorded carbon dioxide, dust, gases, temperature and humidity every one to five minutes. Most of the time the air looked unremarkable. Then, on a Thursday afternoon in late July, one sensor registered a fine-dust concentration of nearly 35,000 micrograms per cubic metre — a level normally associated with a dust storm, not a workplace.
That measurement, and the roughly 113,000 records around it, come from a pilot study published in Annals of Work Exposures and Health by Hongwan Li and colleagues at the University of Oklahoma Health Campus and the University of Wisconsin-Madison (doi.org/10.1093/annweh/wxag074). It is the first published characterisation of indoor air quality inside an Oklahoma cannabis cultivation facility, and one of the first from anywhere in the South-Central United States.
Key Takeaways
Continuous monitoring in a 186-square-metre medical cannabis grow room revealed a workplace with four overlapping environmental burdens rather than one dominant hazard. Carbon dioxide followed the plants’ light cycle, averaging around 1,000 ppm and peaking above 2,200 ppm — well under the occupational limit, but above the general indoor comfort reference for long stretches. Fine particulate matter behaved completely differently: the typical reading was a clean 1.4 to 3.1 µg/m³, but short bursts tied to canopy work pushed readings into the thousands and tens of thousands. Volatile organic compounds, temperatures reaching 41 °C and humidity touching 100% filled in the rest of the picture. None of this proves that any individual worker inhaled those doses — the monitors were fixed to walls and posts, not clipped to collars — and the authors are explicit that this is a single-site pilot with screening-grade instruments. What it does establish is that a small, ordinary grow room can swing between benign and extreme within minutes, and that nobody currently regulates that swing.
What the Oklahoma cannabis cultivation facility air quality study actually measured
The team monitored one HVAC-equipped indoor medical cannabis facility of about 2,000 square feet (roughly 186 m²) from 10 July to 1 August 2023, during the peak of Oklahoma’s heat season. The room held approximately 900 plants moving from early flowering into mid-flowering, ran an approximately 12-hour light and 12-hour dark cycle, used supplemental CO₂ intermittently, and was served by a single-zone HVAC system with no dehumidifier.
Seven instruments were placed across three zones — left wall, centre, right wall — at 1.5 metres above the floor, roughly the breathing height of a standing adult. Three Aranet4 infrared sensors logged CO₂, temperature, humidity and pressure every five minutes. Two TSI AirAssure multi-parameter monitors recorded particulate matter, CO₂, carbon monoxide, nitrogen dioxide, ozone, sulphur dioxide and total volatile organic compounds every minute. Two PurpleAir dual-channel particle counters logged dust every two minutes. After quality control, about 113,000 records remained.
The design matters as much as the numbers. Almost all earlier cannabis exposure work used short visits timed around specific tasks. Running sensors continuously for three weeks captures what the room does when nobody is watching — including the long, quiet nights that a task-based sampling campaign never sees.
Carbon dioxide rises and falls with the lights
The clearest signal in the dataset was a daily CO₂ rhythm locked to the photoperiod. The three infrared sensors recorded means between 979 and 1,086 ppm, with maxima of 2,214 to 2,290 ppm. The two TSI units, running longer and later in the campaign, averaged lower — 883 and 897 ppm.
Concentrations tended to climb through the dark period and peak in the late night or early morning. The intuitive explanation is plant respiration: plants absorb CO₂ under the lights and release it in the dark. The authors resist that shortcut. Without dosing logs for the supplemental CO₂ system, HVAC control records or air-exchange measurements, they cannot separate plant metabolism from enrichment equipment from ventilation behaviour. They describe the pattern as photoperiod-linked and facility-operation-linked, not as proof of dark respiration. Worker breathing was ruled out as the main driver for a simple reason: staff generally left the room once the lights went off.
For context, the NIOSH recommended exposure limit for CO₂ is 5,000 ppm as an eight-hour average, and the facility never came close. But readings sat above the 1,000 ppm general indoor-air reference value from ASHRAE for substantial parts of the day, and concentrations above 1,500 ppm have been associated in other indoor settings with reduced alertness and more symptom reporting. That reference was never designed for rooms deliberately enriched with CO₂ to grow plants — which is precisely the gap the study points to.
The agreement between sensors of the same type was near-perfect: correlations above 0.996 within the Aranet4 cluster and 0.994 between the two TSI units. Correlations between the two different platforms were much weaker (0.18 to 0.45), which the authors attribute to non-overlapping monitoring windows and timestamp conventions rather than to real differences across the room.
Particulate matter: quiet air, then a wall of dust
Dust told the opposite story. Median PM2.5 was 2.0 µg/m³ on both TSI monitors and 1.4 to 3.1 µg/m³ across the PurpleAir channels — genuinely clean air by any indoor standard, suggesting the HVAC system handled background particles well.
The averages, however, were 31 to 185 µg/m³, roughly 50 to 90 times the medians. That gap is the whole finding. A handful of brief events, lasting minutes to a few hours, dragged the arithmetic mean far above anything a person in the room would experience on a normal shift. The statistical fingerprint confirms it: skewness between 8.3 and 14.2, kurtosis between 74 and 225.
The largest excursion came during daytime hours on 27 July, when one TSI monitor logged an hourly maximum of 34,953 µg/m³ and the other 26,982 µg/m³. The facility reported that this coincided with in-flower canopy maintenance — trimming, defoliation or canopy management on flowering plants, not harvest processing. Coarser fractions spiked even higher, with PM10 reaching 63,913 µg/m³ on one unit, which points to mechanically generated or resuspended plant and substrate material rather than combustion-type fine particles.
Two caveats deserve emphasis. First, the TSI PM2.5 measurement is specified up to 1,000 µg/m³, so the extreme peaks should be read as evidence that something dramatic happened, not as precise mass concentrations. Second, no formal task log existed, so the link to canopy work rests on facility recollection rather than timestamped records.
Even with those limits, the pattern echoes earlier work. In Washington State, Silvey and colleagues measured mean PM concentrations of 42 to 60 µg/m³ across grow, trim and pre-roll zones — higher baselines than Oklahoma’s, because they sampled during active tasks rather than around the clock. A NIOSH evaluation at a Minnesota cannabis facility recorded area total particle concentrations averaging 3.4 mg/m³ during a single 45-minute grinding operation.
VOCs, trace gases, heat and humidity
Total VOC concentrations averaged 1.42 mg/m³ at one monitor and 3.61 mg/m³ at the other, with 95th-percentile values reaching up to 15.19 mg/m³. The ethanol-equivalent metric followed the same shape, with one sensor averaging 1,918 ppb and exceeding 8,000 ppb at the 95th percentile. Because the sensor is a broadband metal-oxide device rather than a laboratory instrument, these figures indicate the size and timing of the VOC burden, not which terpenes were present. Earlier work using proper speciation — Samburova and colleagues in Nevada — found monoterpene and sesquiterpene concentrations of 21 to 290 ppb in normal conditions, rising above 1,000 ppb when ventilation was restricted.
Trace gases were mostly unremarkable. Carbon monoxide medians of 1.4 and 2.2 ppm sat far below the NIOSH recommended limit of 35 ppm. Sulphur dioxide was detected at low levels. Nitrogen dioxide and ozone differed sharply between the two monitors, which the authors treat as a screening-level curiosity requiring confirmation rather than a demonstrated spatial gradient.
The thermal environment may be the most immediately relevant finding for workers. Temperatures ranged from 16.9 °C to 41.2 °C, with sensor means of 23 to 28 °C. Relative humidity averaged 72% to 82% and touched 99% to 100%. OSHA heat guidance treats a heat index of 26.7 °C as the start of a warning category. With roughly 900 plants transpiring in a small sealed room and no dehumidifier, high humidity was structural rather than accidental — and it also degrades the accuracy of the very sensors used to measure everything else, which is why the authors ask readers to treat absolute gas and particle values cautiously.
Why Oklahoma is not Colorado or Washington
Oklahoma built one of the largest medical cannabis markets in the country almost overnight. After State Question 788 passed in June 2018, the programme grew until, by 2023, the Oklahoma Medical Marijuana Authority had issued more than 7,300 commercial licences, including over 1,800 dispensaries, and more than 380,000 residents — around 10% of the state population — were registered patients. An OMMA-commissioned analysis concluded the state held 32 times more regulated medical cannabis than patient demand required. A moratorium on new grower licences, imposed in 2022 and extended through August 2026, is the state’s acknowledgement of that oversupply. The federal picture is shifting too, with rescheduling proposals that would change research access and oversight, though as we covered in our reporting on why rescheduling may not unlock the science, the practical effects are contested.
Three things follow from that history. Low barriers to entry attracted small operators working in converted warehouse and commercial spaces, often without the engineering controls of purpose-built facilities. Oklahoma summers — outdoor temperatures routinely above 35 °C with dewpoints above 21 °C — load the HVAC system far harder than a Colorado summer does. And unlike Colorado, which publishes a cannabis occupational safety guide and launched a targeted OSHA enforcement programme for cannabis facilities in 2024, Oklahoma has no cannabis-specific worker safety guidance at all.
The health stakes are not hypothetical. In a companion study at a Washington facility, Sack and colleagues found that 65% of workers reported work-related respiratory symptoms, including cough in 48% and chest tightness in 26%, with 42% meeting criteria for asthma. That was a different state, a different climate and a different facility — but the same plant, and broadly the same tasks. Against a backdrop of steadily rising national consumption, documented in polling that shows more Americans now smoke cannabis than cigarettes, the workforce doing the growing keeps expanding faster than the science describing its exposures.
What the study cannot tell you
This is a pilot in one building, and the authors say so repeatedly. Fixed monitors on walls and posts measure the room, not the person; actual breathing-zone exposures during trimming could be higher, or lower, than anything recorded here. There were no health outcome data, no worker symptoms, no personal sampling, no task logs, no CO₂ dosing records and no pesticide application timestamps. The instruments were new and factory-calibrated but were never validated against reference-grade equipment in the field, so the numbers are screening data suited to spotting patterns and spikes, not compliance measurements. Monitoring periods did not fully overlap across sensor types, and no outdoor background was measured.
What survives all those caveats is a shape: low background, extreme excursions, a CO₂ rhythm tied to the lights, and heat and humidity that sit at the edge of guidance ranges for most of the working day. Facilities that want to act on this do not need a new exposure limit to start — synchronising HVAC records with activity logs, timing canopy work around ventilation, and considering respiratory protection during trimming are all available today. Whether they become standard practice, in a sector whose economics we have examined through the lens of federal legalisation tax modelling, is a policy question rather than a scientific one.
FAQ
No. Oklahoma has no state-level cannabis-specific worker safety guidance, ventilation criteria or exposure limits comparable to Colorado’s published guide, and no cannabis-focused OSHA emphasis programme. Workers in the state’s cultivation facilities are covered by general federal OSHA standards written for other industries — general dust, heat and air contaminant provisions — none of which were developed with grow rooms in mind. That regulatory gap is one of the study’s central arguments for further research.
Not by current occupational standards. The highest readings, above 2,200 ppm, remained well below the NIOSH recommended limit of 5,000 ppm averaged over eight hours. They did exceed the 1,000 ppm general indoor-air reference value for long periods, which is a comfort and alertness benchmark rather than a health limit, and which was not written for rooms where CO₂ is deliberately added.
Not necessarily. The monitors were fixed to walls and support posts, not worn by workers, so they describe the room rather than any person’s breathing zone. The instrument’s stated measurement range also tops out well below the recorded peaks, so the highest figures indicate an extreme event rather than a precise mass concentration. What the data show reliably is that a short maintenance task can raise room dust by three to four orders of magnitude in minutes.
Only cautiously. This was a single site with its own plant density, photoperiod, ventilation design and CO₂ practices, monitored for three weeks in one season. The value of the dataset lies in the patterns it reveals — the coupling between plant lighting and CO₂, and the dual-regime behaviour of dust — rather than in the specific numbers, which should not be treated as representative of the industry.
Legal Disclaimer
This article is journalism about published occupational health research and is provided for information only. It is not medical, legal or occupational safety advice, and it does not establish exposure limits, workplace standards or compliance obligations for any facility. Nothing here should be interpreted as a recommendation to use, cultivate or purchase cannabis. Cannabis laws differ substantially between countries, between US states and between federal and state jurisdictions; readers are responsible for knowing the rules that apply where they live and work. Employers and workers with questions about air quality, ventilation or respiratory protection in cultivation facilities should consult a qualified occupational hygienist and the relevant regulator in their jurisdiction. The measurements described here come from screening-grade sensors in a single pilot study and are not compliance-grade exposure data.